Level 1 CFA® Exam:
Trend Analysis
In this lesson, we're going to discuss the tools used by technical analysts. There are at present many schools of technical analysis. For example, there is the traditional chart analysis and analysis involving elements of statistics. Let's first look at the classic approach.
For over 300 years the basic tool of a technician has been a chart. The most popular types of charts include the following:
- the line chart,
- the bar chart,
- the candlestick chart.
Line Chart
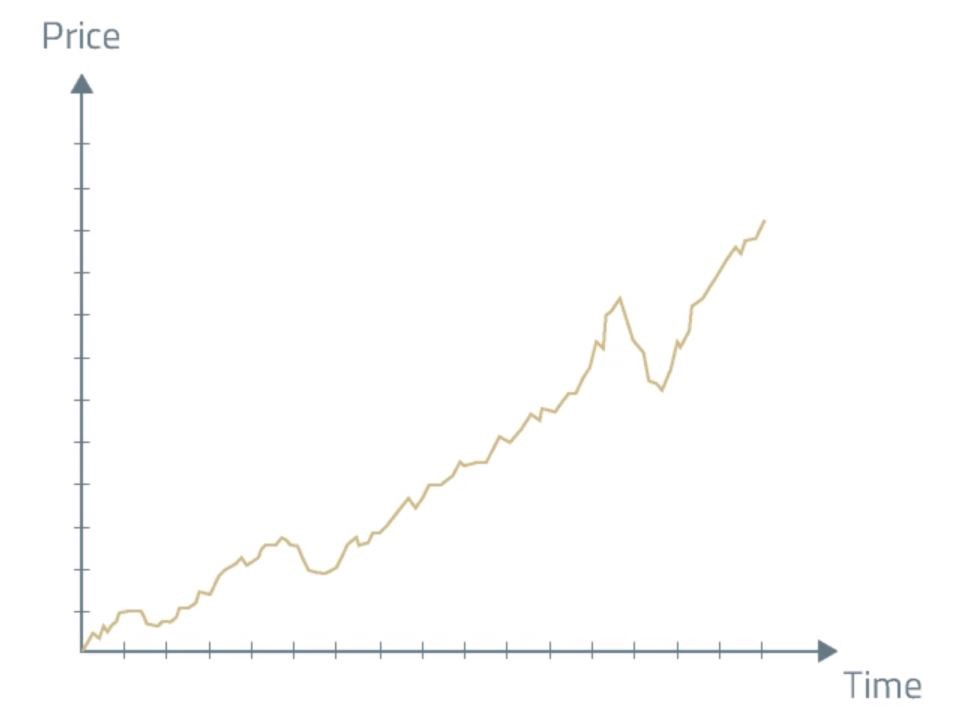
The most basic type of chart is the line chart. The vertical axis represents values of different characteristics (prices, index points, etc.) of the analyzed assets, e.g. stocks. The horizontal axis represents time. The chart itself is a line that most commonly connects data points representing closing prices.
A major benefit of technical analysis is that any time frame can be used. We can use closing prices from every day, hour, or minute of trading.
Bar Chart
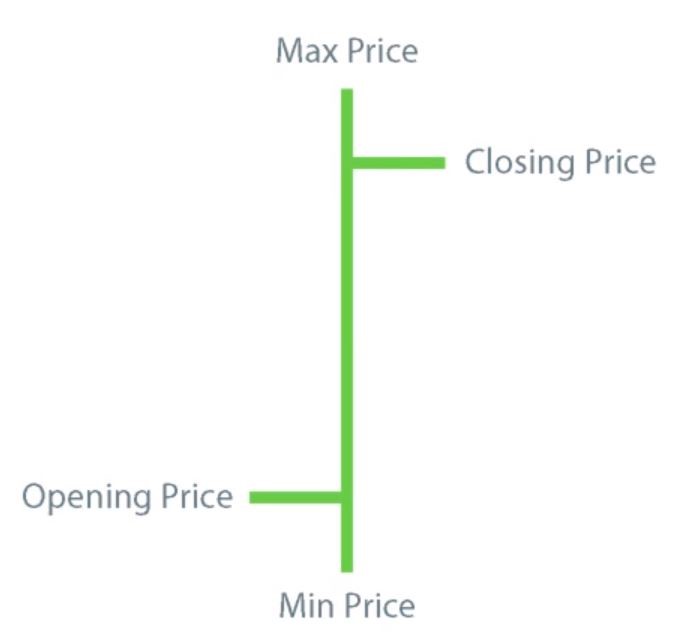
A bar chart contains more information than a line chart. Each period e.g. month, day, or hour depending on the time frame and interval is represented by a bar. The highest and the lowest price in a period are represented by the top and the bottom of a bar respectively.
A cross-hatch to the left indicates the opening price, and the one on the right stands for the closing price. In other words, a bar chart gives us an insight into 4 bits of price data for a selected period: the highest price, the lowest price, the opening price, and the closing price.
Candlestick Chart
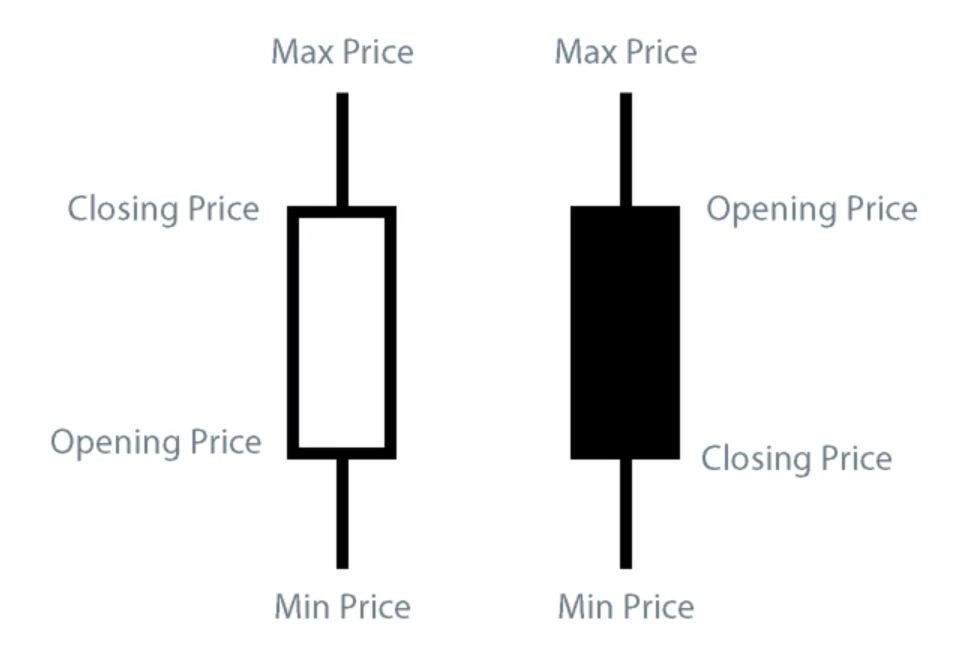
Another type of chart is the candlestick chart. When you look at the chart, it resembles a candle, hence its name. Candlestick charts are a Japanese invention dating back 300 years. Recently they have become popular in the US and Europe.
A candlestick chart includes similar data to a bar chart. Each period is represented by a rectangular bar called the body. If the opening price is lower than the closing price, the body's bottom part indicates the opening price, and the top represents the closing price. If however, the opening price is higher than the closing price, the body's bottom part indicates the closing price, and the top represents the opening price.
Additionally, the body is white (or green) when the closing price is higher than the opening price or black (or red) if the closing price is lower than the opening price. You can also notice that the body includes a horizontal line which we call the shadow, reflecting an asset's price range in the given period.

Bear in mind that charts can take different scales. Whether to choose the linear scale, also called the arithmetic scale, or the logarithmic scale depends on the scope of changes in the analyzed period and how we want to see them displayed.
A volume chart indicating the trading volume of a security is placed at the bottom of most charts.
Another frequently used tool is the relative strength analysis of security against a benchmark. We can use it to check if a company performs better or worse than its industry as a whole.
The notion of trend is key for technical analysis. A trend is the direction in which a market is heading. There are 3 types of trends:
(...)
- The most popular types of charts include the line chart, the bar chart, and the candlestick chart.
- A bar chart and a candlestick give us an insight into 4 bits of price data for a selected period: the highest price, the lowest price, the opening price, and the closing price.
- A trend is the direction in which a market is heading.
- Trends can be analyzed using what we call a trendline, which connects increasingly high lows in the case of an uptrend, and increasingly low highs in the case of a downtrend.
- Price movements against the trend are called retracements.
- Support is a price range lower than the current price in which buyers become active enough to make the prices rebound.
- Resistance is a price range higher than the current price in which the supply side becomes active enough to lead to a decrease in price.