Level 1 CFA® Exam:
Portfolio Risk
Covariance is a measure of linear association between two variables. It tells us if deviations from the mean values for two variables are related to each other. If both variables simultaneously deviate above the mean, or if both are below it, covariance has a positive value.
If the values of the two variables deviate in opposite directions, i.e. one of them is growing and the other is falling or vice versa, covariance has a negative value.
A covariance equal to or close to zero means that there is no linear association between the two examined variables. Note, however, that the absence of linear association does not mean that the variables are not associated. The association between them may be other than linear.
You should remember that the fact that returns of different assets deviate in different directions and with different strengths makes portfolio risk more complicated to determine than the expected portfolio return. But this will be dealt with later. Now let me say more about covariance and the correlation coefficient.
The correlation coefficient is easier to interpret than covariance. Its value ranges from -1 to 1. The relationship between covariance and the correlation coefficient can be expressed as follows:
The correlation coefficient shows how strong the linear association between the variables is. In the case of investment portfolios, the variables are returns of assets.
(...)

Portfolio risk is not equal to a weighted average of the risks of individual assets included in a portfolio. Portfolio risk is affected by the covariances between the individual assets that make up the portfolio.
When calculating the standard deviation of a portfolio, we should take into consideration the mutual relationship between the assets that we have just discussed. The variance of a portfolio of many assets can be expressed using these formulas:
Please note that both formulas are correct. This is a consequence of the fact that the covariance of A and A is equal to the variance of A.
Here is the formula for the standard deviation of a portfolio comprising two assets (A and B):
Notice that a key element affecting portfolio risk, apart from the risks of individual assets, is the covariance between these assets. The lower the covariance, the lower the portfolio risk and, consequently, the stronger the effect of portfolio diversification.
An investor should know the effect of the correlation between assets on portfolio risk. Let's now consider different values of correlation and their implications for a portfolio. To simplify our analysis, we are going to take a two-asset portfolio as an example.
Correlation of two assets is +1.
Where the correlation of two assets is +1 (i.e. when we're dealing with a perfect positive correlation), the portfolio risk is equal to the weighted average risk of individual assets in the portfolio. Also, remember that in this case, the diversification of the portfolio doesn't allow us to reduce the portfolio risk.
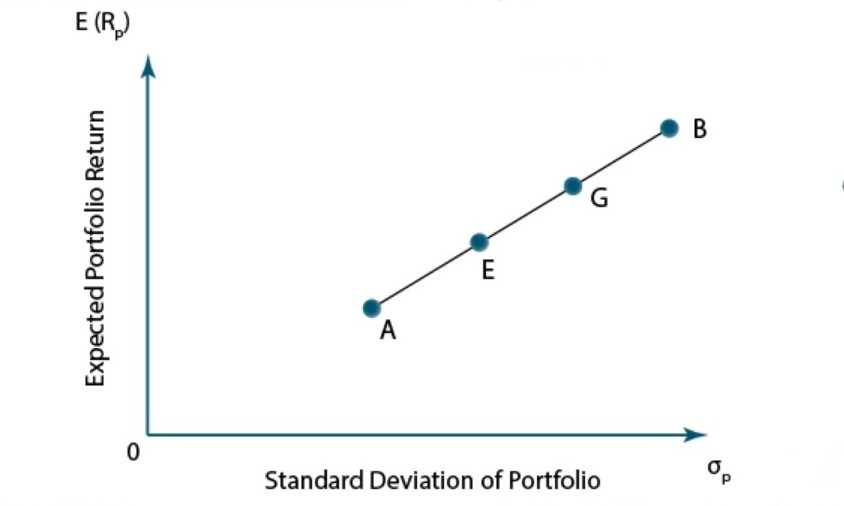
In the graph, you can see 4 portfolios: A, E, G, and B, and their expected returns and standard deviations. All portfolios compromise only two assets: A and B.
But the weights of the assets in the portfolios are different. Portfolio A consists only of asset A and portfolio B consists only of asset B. Portfolios E and G are compromised of both assets but the weight of asset A in portfolio E is greater than in portfolio G.
What can we deduct from this graph?
First of all – as you can see – because asset A is less risky than asset B as it has a lower standard deviation, portfolio E is less risky than portfolio G. What’s more, because the coefficient of correlation between assets A and B is equal +1 (perfect positive correlation), all four portfolios are lying on the same straight line. So, in the case of risk and return trade-off, there are no advantages of diversification if the correlation coefficient between assets equals +1.
Correlation of two assets is lower than +1.
(...)
To gain a more in-depth understanding of the significance of correlation and the importance of diversification, let's imagine that we invest by buying stocks of an oil company. The company's profits are forecast to rise if crude oil prices increase, which in consequence will bring about a return on the stocks of 10%. If crude oil prices remain constant or fall, the estimated return will be 0%. Suppose the probability of an increase in crude oil prices is 50%. The expected return is:
(...)
Suppose an investor spends 40% of his funds on corporate bonds with a 12% standard deviation and 60% of the portfolio is going to be an ETF reflecting the behavior of the S&P500 with a standard deviation of 18%. The correlation between the corporate bonds and the ETF is 0.8. What is the standard deviation of the portfolio?
We need to use the formula for the risk of a two-asset portfolio:
\(\sigma_{P} = \sqrt{w^{2}_{1}\times \sigma^{2}_{1} + w^{2}_{2}\times \sigma^{2}_{2} + 2\times w_{1}\times w_{2}\times Cov(R_{1},R_{2})}\)
\(\sigma_{P} = \sqrt{w^{2}_{1}\times \sigma^{2}_{1} + w^{2}_{2}\times \sigma^{2}_{2} + 2\times w_{1}\times w_{2}\times\sigma_{1}\times\sigma_{2}\times\rho_{1,2}}\)
\(\sigma_{P} = \sqrt{(0.4\times0.12)^2 + (0.6\times0.18)^2 + 2\times 0.4\times 0.6\times0.12\times0.18\times0.8}\)
\(\sigma_{P} = 14.92\%\)
- Covariance is a measure of linear association between two variables.
- The value of the correlation coefficient ranges from -1 to 1.
- A correlation coefficient of +1 shows a perfect positive correlation between returns.
- A correlation coefficient of 0 shows that the returns are not correlated at all.
- A correlation coefficient of -1 shows a perfect negative correlation between returns.
- Each portfolio is characterized by its expected return and its risk measured with standard deviation (or variance).
- Portfolio return is a weighted average of the returns of the individual assets in a portfolio.
- Standard deviation of a portfolio is usually lower than the weighted average of the standard deviations of individual assets in a portfolio. This is because returns of the assets in a portfolio are more or less correlated with each other.
- Portfolio diversification allows us to maintain return at a specified level while reducing risk.