Level 1 CFA® Exam:
Estimators & Confidence Intervals
Statistical inference can be divided into two parts:
- hypothesis testing, and
- estimation.
Hypothesis testing can help us answer questions such as whether the population mean is equal to 10% or not? The whole reading in the CFA curriculum is devoted to hypothesis testing.
As far as estimation is concerned, it helps us answer the following question: what is the value of a population parameter with a given probability? In other words, thanks to estimation we can for example state that with 95% probability the population mean will be within a given interval.
To fully understand estimation, we have to introduce the concepts of estimators and confidence intervals.
An estimator is a formula used to estimate the value of a parameter of a distribution. For example, if we want to estimate the average return on a population of bonds, we can draw a sample of bonds and compute the sample mean. The sample mean will be an estimator that we will use to estimate the value of the population mean. Note that the particular value that we calculate from a sample using an estimator formula is called an estimate.
To allow us to estimate the parameters of a population correctly, estimators should be:
- unbiased,
- efficient, and
- consistent.
Let's discuss the properties of good estimators that we've just enumerated one by one:
(...)

There are two types of estimation that we can perform:
- point estimation, and
- interval estimation.
We use a point estimate when we need a single value as an estimate of a population parameter. For example, the point estimate of the population mean is the sample mean. When we use a point estimate, we must simply find the correct estimator of the parameter.
In point estimation, we seek to arrive at a concrete number, that is the value of the parameter, while in the case of interval estimation we need to find a range of values that we expect to include the parameter with a particular degree of confidence. This range of values is called the confidence interval.
Confidence interval is a range of values that we expect to include the parameter with a particular degree of confidence.
For the confidence interval:
- the lower confidence limit is equal to the point estimate minus the reliability factor times the standard error, and
- the upper confidence limit is equal to the point estimate plus the reliability factor times the standard error.
Note that the point estimate is the value of the sample mean.
Standard error equals population standard deviation divided by the square root of the size of the sample, or standard error equals sample standard deviation divided by the square root of the size of the sample.
The value of the reliability factor depends on the so-called degree of confidence. The greater the degree of confidence, that is the more we want to be sure that the parameter is within a given confidence interval, the greater the reliability factor. What is more, the greater the reliability factor, the wider the confidence interval.
A confidence interval can be expressed as follows:
\(100\times(1-\alpha)\%\)
Where:
Alpha is the probability of an error, namely that the parameter is not within the confidence interval.
Have a look at the graph. Alpha is the sum of the two areas in the distribution curve's tails:
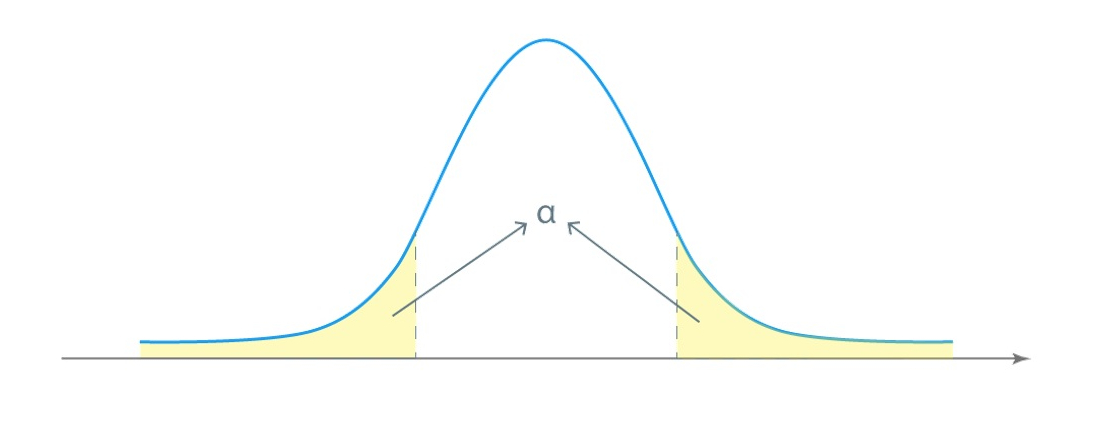
\(1-\alpha\) is the degree of confidence, which multiplied by 100% gives the value in percentage terms.
For example, if we assume that there is, let's say, a 5% chance that the parameter is outside of the confidence interval, we can be 95% certain that the interval contains the value of the parameter.
The algorithm of a population mean interval estimation looks as follows:
(...)
- An estimator is a formula used to estimate the value of a parameter of a distribution.
- An estimator is unbiased when its expected value equals the parameter it is intended to estimate.
- An estimator is efficient when its variance is the smallest among the unbiased estimators of the same population parameter.
- An estimator is consistent when the probability that an estimate will be close to the population parameter gets bigger as the sample size increases.
- In point estimation, we seek to arrive at a concrete number, that is the value of the parameter, while in the case of interval estimation we need to find a range of values that we expect to include the parameter with a particular degree of confidence.
- Confidence interval is a range of values that we expect to include the parameter with a particular degree of confidence.
- For the confidence interval, the lower confidence limit is equal to the point estimate minus the reliability factor times the standard error and the upper confidence limit is equal to the point estimate plus the reliability factor times the standard error.