Level 1 CFA® Exam:
Normal Distribution
A normal distribution is a symmetrical, bell-shaped distribution that is characterized by two parameters: mean and variance.
In this lesson, we're going to elaborate on one of the most important types of probability distributions, which is the normal distribution. Why is the normal distribution important to us?
- First of all, we can find examples of the normal distribution around us in real life.
- What’s more, many models used in finance assume the normal distribution.
- Finally, the central limit theorem that is based on the normal distribution is widely used in statistics.
So far, we've focused on univariate normal distributions. But there are also multivariate normal distributions.
Here are the definitions of the 2 types of normal distributions:
- univariate normal distribution describes a single random variable, for example, the return on a company’s stock, and
- multivariate normal distribution describes a group of random variables related to each other (multivariate distributions are often used in practice, for example in the portfolio theory).
Suppose we're interested in a portfolio of assets and its distribution. Because the assets form a portfolio we're not going to consider the distribution of each asset separately. Instead, we will focus on the distribution of the total portfolio. We can distinguish 3 groups of parameters that characterize the distribution of the total portfolio of assets:
- The first group contains all mean returns of assets.
- The second consists of variances of returns or standard deviations of returns for the assets.
- Finally the third group consists of correlations between each pair of asset returns.
Correlation is a measure of a linear relationship between two variables. In our example, the correlations affect the variance of the entire portfolio. The more the assets are correlated, the greater the variance of the portfolio and vice versa. The less the assets are correlated, the lower the variance of the portfolio.
Key characteristics of a normal distribution:
(...)
Characteristics of the normal distribution allow us to make many different statements about the probability of the normally distributed random variable.
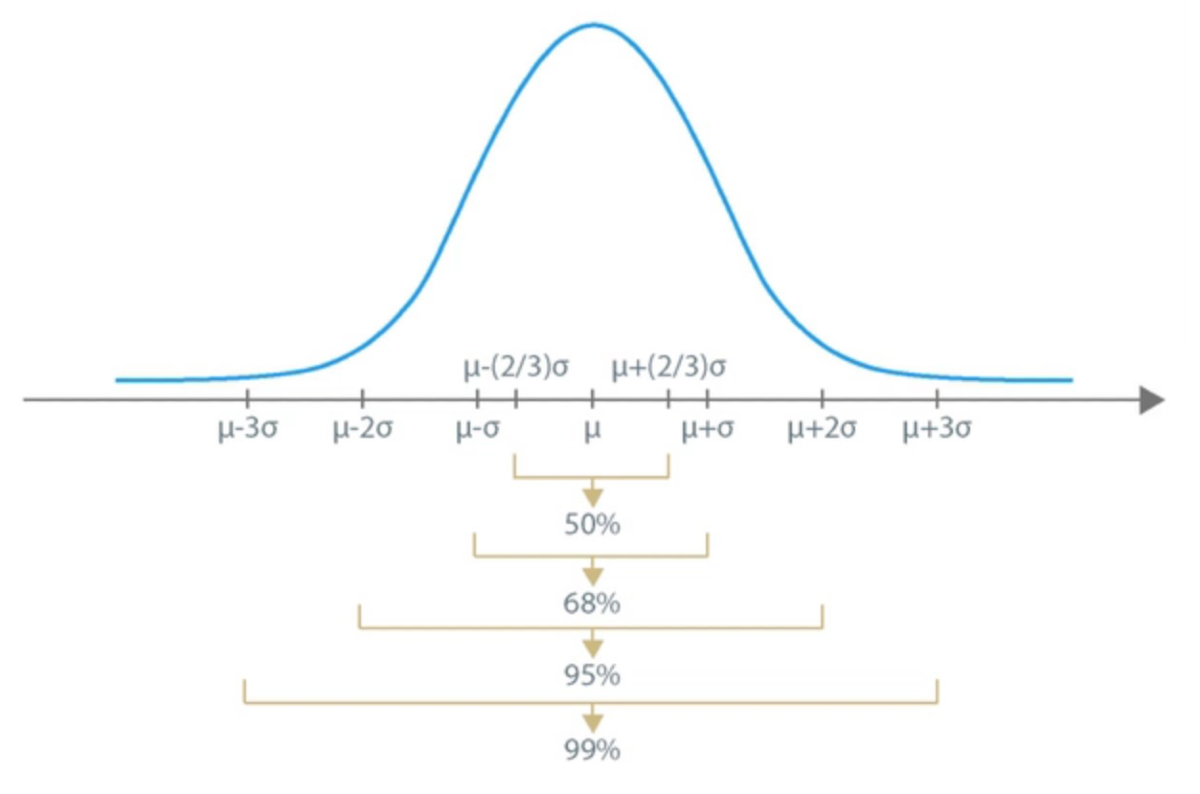
For example, we can say that for every normal distribution:
- Approximately 50% of observations fall within a two-third standard deviation interval about the mean.
- Approximately 68% of observations fall within a one standard deviation interval about the mean.
- Approximately 95% of observations fall within a two standard deviation interval about the mean, and
- Approximately 99% of observations fall within a three standard deviation interval about the mean.
Suppose the return on a certain stock, characterized by a normal distribution, is 10% on average. The standard deviation equals 15%. What is the probability that the return on the stock is within 2 standard deviations about the mean? and how many observations fall into the interval from minus 20% to 40%?
The probability that the return on the stock is within 2 standard deviations about the mean is 95%.
To answer the second question, we should realize that the interval from minus 20% to 40% is the interval from 2 standard deviations below the mean to 2 standard deviations above the mean. So, also 95% of the observations will be in this interval.
Suppose that the return on a certain stock, characterized by a normal distribution, is 10% on average. The standard deviation equals 15%. How many observations fall into the interval from minus 5% to 40%?
(...)
Since the normal distribution is characterized by two parameters, mean and variance, there is an infinite number of normal distributions. One of them, which is characterized by mean equal to 0 and standard deviation equal to 1, is called the unit normal distribution or the standard normal distribution. A standard normal random variable is denoted as \(Z\).
Standard normal distribution (aka. unit normal distribution) is a standardized normal distribution characterized by mean = 0 and standard deviation = 1.
The probabilities for the standard normal distribution can be found in tables of the cumulative distribution function for the standard normal random variable.
Every normal distribution can be transformed into the standard normal distribution. The adaptation of a normal random variable of any normal distribution to the standard normal random variable is called standardizing. Standardizing is carried out based on this formula:
The stock returns are normally distributed with \(\mu=10\%\) and \(\sigma=15\%\). What is the probability that a rate of return is less or equal to 0%?
(...)
We know that:
There is a normal distribution with a mean and standard deviation of any value, and that there is some value X we are interested in.
The algorithm is as follows:
- We standardize the normal distribution, or in other words, we calculate \(Z\).
- In the table of the cumulative distribution function for the standard normal random variable, we look for the probability that the random variable value is lower than \(Z\) (we can also use Excel).
- We come to the answer and state the probability that the random variable is lower than X.
We can apply the algorithm after introducing relevant changes to it, not only to calculate the probability that the random variable is lower than a given value but to state any other probability.
We consider the same normal distribution as before with \(\mu=10\%\) and \(\sigma=15\%\). What's the probability that the return on the stock falls into the interval from minus 18% to 42%?
(...)
Let’s sum up what we’ve learned so far.
The tables available in the CFA exam contain cumulative probabilities for a standard normal distribution. Each value that you can find in the tables corresponds to the probability that the value of a random variable is lower or equal to \(Z\) score. The value of the probability matches the area under the density function to the left of the value of \(Z\).
If we have to solve a problem where the random variable value is greater than a given \(Z\) value, which means that we're looking for a probability equal to the area under the density function to the right of \(Z\), we subtract the \(F(Z)\) from 1. If we have to calculate the probability that the random variable falls into a given interval, we have to subtract the F(lower value) from the F(greater value).

Roy's Safety-First Criterion & Safety-First Rules
As you know the normal distribution is widely used in financial analysis. It's often assumed that returns on securities have a normal distribution. For example, modern portfolio theory, which draws on mean-variance analysis, is based on this assumption. The assumption that returns are distributed normally is also used in safety-first rules and Roy's safety-first criterion.
In modern portfolio theory we identify risk with volatility. On the other hand, safety-first rules are downside risk measures because they concern shortfall risk. Shortfall risk is the risk that the value of a portfolio falls below a pre-defined threshold level in a specified time period. According to Roy's safety-first criterion, we should choose portfolios characterized by the highest safety-first ratio given by the following formula:
By dividing the expected return on the portfolio minus threshold return (minimal return) by the standard deviation, we get the shortfall risk expressed as the possible decrease in the return on the portfolio in units of standard deviation.
From a set of portfolios, a portfolio with the highest safety-first ratio is the safest one, because for this portfolio the risk that the actual return on a portfolio is lower than the threshold return is the lowest.
Let's consider two portfolios, portfolio A and portfolio B:
| Portfolio A | Portfolio B | |
|---|---|---|
| \(E(R_P)\) | 20% | 10% |
| \(\sigma_P\) | 28% | 12.5% |
| \(R_t\) | 2% | 2% |
Which portfolio is safer according to Roy's safety-first criterion?
(...)
Value at Risk (VaR)
(...)
- A normal distribution is a symmetrical, bell-shaped distribution that is characterized by two parameters: mean and variance (note that instead of variance we can use standard deviation as one of the parameters).
- A normal density function is symmetrical and bell-shaped, whatever its parameters. Because its graph plots symmetrically, the mean equals the mode and the median. Each normal distribution has a kurtosis of 3.
- A linear combination of normally distributed random variables also has a normal distribution.
- A univariate distribution describes a single random variable whereas multivariate normal distribution describes a group of random variables related to each other.
- For every normal distribution approximately 68% of observations fall within a one standard deviation interval about the mean, approximately 95% of observations fall within a two standard deviation interval about the mean, and approximately 99% of observations fall within a three standard deviation interval about the mean.
- Standard normal distribution (aka. unit normal distribution) is a standardized normal distribution characterized by mean = 0 and standard deviation = 1.
- The probabilities for the standard normal distribution can be found in tables of the cumulative distribution function for the standard normal random variable.
- Safety-first rules are downside risk measures because they concern shortfall risk.
- Shortfall risk is the risk that the value of a portfolio falls below a pre-defined threshold level in a specified time period.
- According to Roy's safety-first criterion, we should choose portfolios characterized by the highest safety-first ratio.
- Value at Risk is a measure of downside risk because it is the measure that informs us about the minimal amount of money we can lose with a given probability.