Level 1 CFA® Exam:
Projecting Net Income & Cash Flows
We project near-term performance to obtain inputs for market-based valuation, e.g. if a forward P/E ratio (“forward P/E” taking into account the forecasted next year’s net income and the current price) for an industry is 30, then if we project the next year’s income for a company (e.g. USD 40 million), we will be able to estimate its current market value and value per share (assuming 50 million shares):
\(ECMV=\text{forward}\frac{P}{E}\times{NI}=30\times40=\text{USD }1.2\text{ billion}\)
\(VPS=\frac{ECMV}{\text{no. of shares}}=\frac{\text{USD }1.2\text{ billion }}{\text{50 million shares}}=\text{USD }24\)
Note: There are different kinds of multiples used in market-based valuation but generally they are categorized into 2 groups:
- Price multiples, e.g. P/E ratio,
- Enterprise value (EV) multiples, e.g. EV/EBITDA.
How can we project net income or some other type of income that we would like to use in our market-based valuation?
If we are dealing with a stable, diversified business, we can use past performance to project net income. However, in the case of startups and companies that operate in a more volatile environment, we should use past performance with caution.
Very often a top-down approach to projecting the company’s sales is used:
- we start with the whole economy (expected changes in GDP, cycle, etc.),
- then we project sales for the industry the company operates in (often using regression analysis and historical data)
- then we project the company’s market share using historical data and growth prospects for the company
- finally we estimate the company’s sales as industry sales multiplied by the company’s market share (in %).
Remember that the depth of the analysis may vary. For example, it can be very complex and we can project the sales for each product line, or geographical or business segments, and so on.
After we get the projection for sales, we can project income by:
- either forecasting expenses (aggregate or not) in nominal values and then subtracting them from the sales, or
- using common-size income statements (all data presented as a percentage of sales) and forecasted profit margins.
Side note: Net profit margin takes financial leverage and taxes into account, so pay attention not only to data related to operations (like in the case of gross profit margin or operating margin) but also to expected future decisions by management (related to financial leverage) and regulatory authorities (related to tax rates).
It is harder to forecast sales and profits for:
- new companies (because of the scarcity of valid data),
- companies with volatile income (because it’s harder to forecast when the volatility is high),
- companies with large fixed costs (because if the company has large fixed operating costs related to variable costs, the operating leverage is high, which means that a slight change in sales can have a large impact on operating income. We can extend this analysis even further. If fixed financial costs are large, the financial leverage is high, which means that a small change in operating income will have a great impact on net income.)
During analysis remember to:
- remove non-recurring items to clear the results from any distortions and one-time events,
- always conduct sensitivity analysis, to check the impact of a change in inputs on the output of the analysis.
(...)
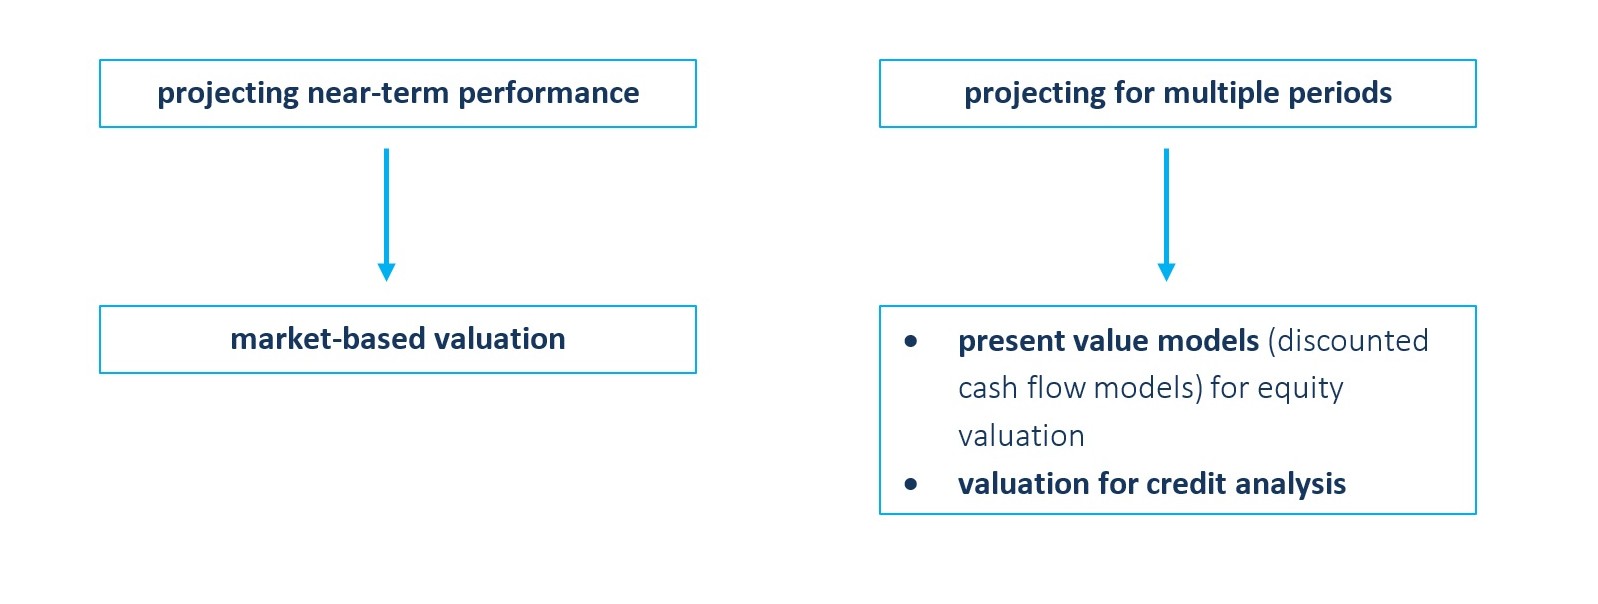
- We project near-term performance to obtain inputs for market-based valuation.
- There are different kinds of multiples used in market-based valuation but generally they are categorized into 2 groups: price multiples and enterprise value (EV) multiples.
- Very often a top-down approach to projecting the company’s sales is used.
- We project for more periods when using present value models, like the dividend discount model (DDM), free cash flow to firm model (FCFF), or free cash flow to equity model (FCFE), to value the company OR for credit analysis purposes.
- Usually we make detailed projections for at least 5 years.