Level 1 CFA® Exam:
Simple Linear Regression
In this lesson we're going to deal with a simple linear regression (SLR) and other statistical techniques used in financial modelling. Statistical methods and econometrics find wide application in capital markets, so thorough knowledge of quantitative methods used for valuation is extremely important.
As a chartered financial analyst to be, a CFA candidate needs to be able to interpret and analyze linear regression models because it is one of the most important skills that a financial analyst should possess.
Defining Simple Linear Regression
Let's start with the basics, that is with defining regression and distinguishing between different types of variables used in regression analysis. There are two types of random variables, namely:
- a dependent variable, and
- an independent variable.
(...)
We want to explain an increase in net income earned by ABC S.A. by using GDP growth in Malaysia. Which variable is a dependent and which is an independent variable?
A dependent variable is an increase in ABC S.A.'s net income because its variation is explained using GDP growth in Malaysia. So, GDP growth in Malaysia is an independent variable.
To apply linear regression we have to assume that the correlation between the two variables is greater than zero. Otherwise the relationship would have no statistical significance.
In the graph you can see an example scatter plot for this relationship:
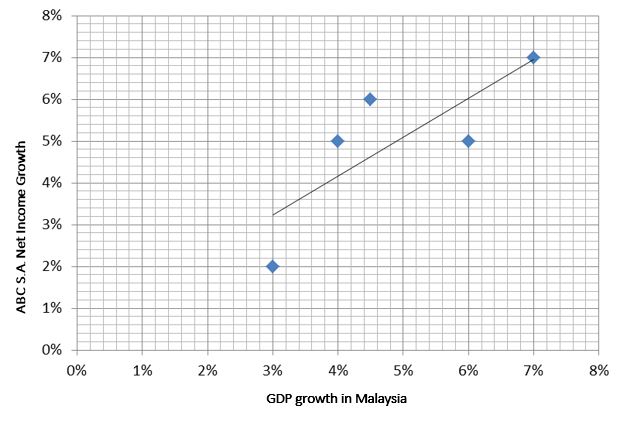
Note that the relationship is of a linear nature, which indicates a positive correlation between the dependent variable, that is increase in the net income, and the independent variable, that is GDP growth in Malaysia.
Let's now have a look at how to interpret linear regression model coefficients.
The intercept (also known as the constant) is the value of the dependent variable if the slope coefficient equals 0 or if the independent variable equals 0.
A slope coefficient is a change in the dependent variable caused by a one-unit change in the independent variable.
Example 2 is a good illustration of how to interpret regression coefficients.
We assume that the dependent variable is a change in the net income of ABC S.A. in a given year and the independent variable is a GDP change in the same year. Let's assume an intercept of 0.023 and a slope coefficient of 0.012, and then interpret the model.
(...)
Stock Return vs Index Return
When we're examining the relationship between a dependent variable, that is the return on a stock, and an independent variable, that is the return on an index (e.g. the market), the slope coefficient constitutes the beta coefficient for the company in reference to the index, whereas the intercept is the ex-post alpha.
(...)
Let's now move on to the assumptions that need to be fulfilled if we want to use regression analysis.
Here is the full list of assumptions underlying the linear regression model:
- There is a linear relationship between the dependent and independent variables (linearity),
- The error term has an expected value of zero,
- Regression residuals have the same variance for all observations (homoscedasticity),
- Independent variables are uncorrelated to error terms,
- There is no correlation between regression residuals in time (independence),
- Regression residuals have a normal distribution (normality).
Note that the first condition is essential for the linear regression model to be correct. Regression estimates a straight line on a scatter plot, which best explains (or in other words best fits) the values of the dependent variable for each value of the independent variable.
The estimated regression model (also called the fitted model) is given by this formula:
The regression line which you can see in the graph above is the result of the MINIMIZATION of the sum of the squared residuals, that is the sum of the differences between an estimated \(\hat{Y}\) and the actual value of an observation. The sum of the squared residuals is also called the sum of squared errors (SSE) or the residual sum of squares.
Depending on the relationship between the dependent variable and the independent variable, the slope coefficient may be positive, negative, or equal to zero. The slope coefficient is given by the following formula:
The intercept is nothing else than the intersection of the regression line with the Y-axis and can be expressed by this formula:
The assumptions of regression analysis are anything but easy to understand and remember. This is why we're going to have a look at another example of how to use these assumptions in practice.
An analyst wants to compute the intercept and the slope coefficient for a regression equation in which the dependent variable is an increase in ABC S.A.'s net income and the independent variable is GDP growth in Malaysia. The following data is available:
The covariance between variables equals 0.075. The variance of GDP growth equals 0.11. The mean of the GDP growth equals 3% and the mean of the increase in ABC S.A. net income amounts to 4%. What are the values of intercept and slope coefficient for a regression equation?
(...)
Now that we have defined the slope coefficient and the intercept, we can move on to the standard error of estimate (SEE).
Standard error of estimate (SEE) is a measure of dispersion of the actual dependent variable from its estimated value in the regression model.
So, SEE is simply a measure of how the regression line fits the actual values. The lower the standard error of estimate, the better the model fits the actual data. Another terms used for SEE is standard error of regression, or root mean square error.
In your level 1 CFA exam, you can compute the standard error of estimate using this simplified formula:
Where there is a strong relation between the dependent and the independent variables, the SEE will be relatively low compared to total variation. If there is a weak relation between the variables, SEE will be relatively higher.
Another important concept in regression analysis is the coefficient of determination.
The coefficient of determination indicates the percentage of the total variation in the dependent variable which is explained using the independent variable. For example, a coefficient of determination equal to 0.7 means that the independent variable explains 70% of the variation in the dependent variable.
(...)
It's an important part of the financial analyst's job to interpret the confidence intervals of a regression model. This is what we're discussing next.
Constructing a confidence interval for regression model parameters is used to estimate whether parameters are statistically significant. This solution can be used when examining the significance of critical variables in a model, such as the CAPM model, or estimating the significance of a given independent variable that has an effect on changes in, say, GDP.
Note that hypothesis testing regarding regression parameters is only possible if we know the estimated parameters, the hypothetical value of the parameters as well as the confidence interval for the estimated parameters. We need to know these 3 factors.
A confidence interval is an interval of values in which the slope coefficient lies with a given probability:
- The slope coefficient is greater than the estimated slope coefficient less the critical value of the t-test for the specified level of confidence with (n-2) degrees of freedom times the standard error of the coefficient.
- The slope coefficient is lower than the estimated slope coefficient plus the critical value of the t-test for the specified level of confidence with (n-2) degrees of freedom times the standard error of the coefficient.
When the standard error of estimate goes up, so does the standard error of the estimated regression coefficient, which makes the confidence intervals expand. This is because SEE goes up when the dispersion of data from the regression line increases, which results in lower confidence in the regression model for the estimation of the slope coefficient.
Let's have a look at an example.
Let's assume the estimated value of the slope coefficient is 0.6818. The standard error of the slope coefficient is 0.2. Assuming 25 observations and a significance level of 5%, calculate the confidence interval for the slope coefficient.
(...)

- A simple linear regression is the relationship between the variation of a dependent variable and the variation of a single independent variable.
- The intercept (aka. constant) is the value of the dependent variable if the slope coefficient equals 0 or if the independent variable equals 0.
- A slope coefficient is a change in the dependent variable caused by a one-unit change in the independent variable.
- The main assumptions underlying the linear regression model: linearity, homoscedasticity, independence, and normality.
- The standard error of estimate (SEE) is a measure of the variation of the real independent variable from its estimated value in the regression model.
- The coefficient of determination (\(R^2\)) indicates the percentage of the total variation in the dependent variable which is explained using the independent variable.
- Constructing a confidence interval for regression model coefficients is another way of estimating whether coefficients are statistically significant, that is different from zero.