Level 1 CFA® Exam:
Introduction to Descriptive Statistics & Data Visualization
Descriptive Statistics vs Statistical Inference in Level 1 CFA Exam
star content check off when doneAppropriate use of statistical methods can help us extract lots of valuable information from available data. In this lesson, we're going to deal with the fundamentals of statistics and explain some basic concepts. We're going to focus on descriptive statistics, the first step in data analysis that allows us to characterize certain phenomena. The methods discussed here and some subsequent lessons are also the foundation of inferential statistics, which we're going to deal with later.
Statistics is a science that deals with quantitative methods of studying the regularities of large-scale phenomena (ones that display certain characteristics in a large number of events that we cannot observe in their individual instances).
We can distinguish between two main branches within statistics:
- descriptive statistics, and
- inferential statistics.
Descriptive statistics deals with the synthesis, processing, and presentation of data.
Inferential statistics (statistical inference) is aimed at making generalizations concerning a population based on its sample.
Assume we want to examine the average salary in the British private sector. Because of the costs and time involved, it would be difficult to observe all the people employed in the private sector. What we need to do is to randomly select a number of people, i.e. draw a sample. Based on the sample, we try to infer conclusions on the entire population using methods based on the probability theory.
Population consists of all elements of a group. We can see it as a set of all the members of the group we're interested in. A descriptive characteristic of a population is called a parameter. A parameter can be for example a mean value.
On the other hand, a sample is a subset of a population. A sample is usually selected randomly and a random sample is another key term in statistics. A sample is described by the so-called sample statistic (statistic for short), for example, a sample mean.
Numerical Data vs Categorical Data
Data is defined as a collection of numbers, words, characters, images, videos, etc. given in an organized or unorganized (raw) form. Statistics uses a variety of data that we have to somehow obtain, measure, summarize, and visualize.
We can divide data into 2 groups:
- numerical data (aka. quantitative data) which includes continuous data and discrete data, and
- categorical data (aka. qualitative data) which includes nominal data and ordinal data.
(...)
There are two types of data that you can encounter while working as an analyst:
- cross-sectional data, and
- time-series data.
Cross-sectional data are data showing the values of properties of different things at a specific point in time, for example, share prices listed on the Warsaw Stock Exchange on a given day.
Time-series data is a set of observations at different times. One example would be a change in the price of a listed company's shares for a certain period of time.
In practice, these data are often combined. So, we have panel data.
Panel data describe one or more variables of multiple observational units over a period of time. An example of panel data may be monthly returns & standard deviations of stocks listed on the Warsaw Stock Exchange during one year. Panel data are usually given in a data table.
| Structured Data | Unstructured Data |
|---|---|
| Structured data are data organized in a pre-defined way. Structure data are usually presented in one-dimensional arrays or two-dimensional data tables. | Unstructured data is data not organized in a pre-defined way. |
| Easy to analyze out of the box. | Requires adjustment, transformation, and organization to the form of structured data that can be easily analyzed by computers. |
| Examples: market data issued by stock exchanges, fundamental data from financial statements, analytical data like cash flow projections | Examples: news, social posts, company filings with regulators, audio/video like podcasts, managements’ calls, etc. |
| Structured data are collected from conventional sources. | Unstructured data are collected from unconventional sources, e.g. produced by individuals (e.g. social posts, blogposts), generated by business processes, generated by sensors (e.g. satellite imagery, traffic data from mobile devices). |
One-Dimensional Array
An example of a one-dimensional array:
| Year | Rate of return (%) |
|---|---|
| 2014 | 4 |
| 2015 | 15 |
| 2016 | 31 |
| 2017 | 22 |
| 2018 | -19 |
| 2019 | -9 |
| 2020 | 12 |
| 2021 | 4 |
| 2022 | -1 |
Data Table
An example of a two-dimensional data table (two-dimensional rectangular array):
(...)
Frequency Distribution
Data can be summarized using frequency distributions. A frequency distribution groups observations into intervals, also called classes, or bins. In this method, data are usually presented in a table that makes it easier to work with large numbers of observations.
A frequency distribution is made up of intervals that include observations within a set range of values.
Absolute frequency is the number of observations falling in an interval.
Relative frequency is absolute frequency divided by the number of all observations.
Another important concept is cumulative relative frequency. It's the sum of the relative frequencies of consecutive intervals. For example, a cumulative relative frequency of 80% for an interval means that 80% of observations are below the upper limit of the interval.
To get a better understanding of the concepts we're discussing, have a look at the example.
Frequency distribution of the rates of return on a stock for 12 quarters is given in the table:
| Range of rates of return (%) | Absolute frequency | Cumulative frequency | Relative frequency (%) | Cumulative relative frequency (%) |
|---|---|---|---|---|
| -2.0 to -1.0 | 2 | 2 | 16.67 | 16.67 |
| -1.0 to 0.0 | 0 | 2 | 0.0 | 16.67 |
| 0.0 to 1.0 | 4 | 6 | 33.33 | 50.00 |
| 1.0 to 2.0 | 3 | 9 | 25.00 | 75.00 |
| 2.0 to 3.0 | 3 | 12 | 25.00 | 100.00 |
Analyze cumulative frequency, relative frequency and cumulative relative frequency for different intervals.
(...)
To summarize data for one variable, we can use a frequency distribution. However, when we want to summarize multiple variables simultaneously we can use a contingency table. A contingency table presents frequency distributions of different variables in a way that allows us to find patterns between these variables.
A contingency table is used for categorical variables. In the case of 2 variables, we call it a two-way table. R x C two-way table means that there are R rows representing R categories of the first variable and C columns representing C categories of the second variable.
Have a look at these four 3x3 two-way tables.
(...)
A graphic representation of data is very useful as a quick way of getting acquainted with statistical observations. The most common tools for graphic presentation of data are:
- histogram,
- frequency polygon,
- cumulative frequency distribution chart,
- bar chart (including grouped bar chart & stacked bar chart),
- tree-map,
- word cloud (aka. tag cloud),
- line chart (including bubble line chart),
- scatter plot, and
- heat map.
Histogram
A histogram is a bar chart in which each bar represents an interval. The height of each bar indicates the frequency for an interval. Using a histogram we can quickly and easily find out which interval includes the most observations. Have a look at a histogram illustrating the example with rates of return.
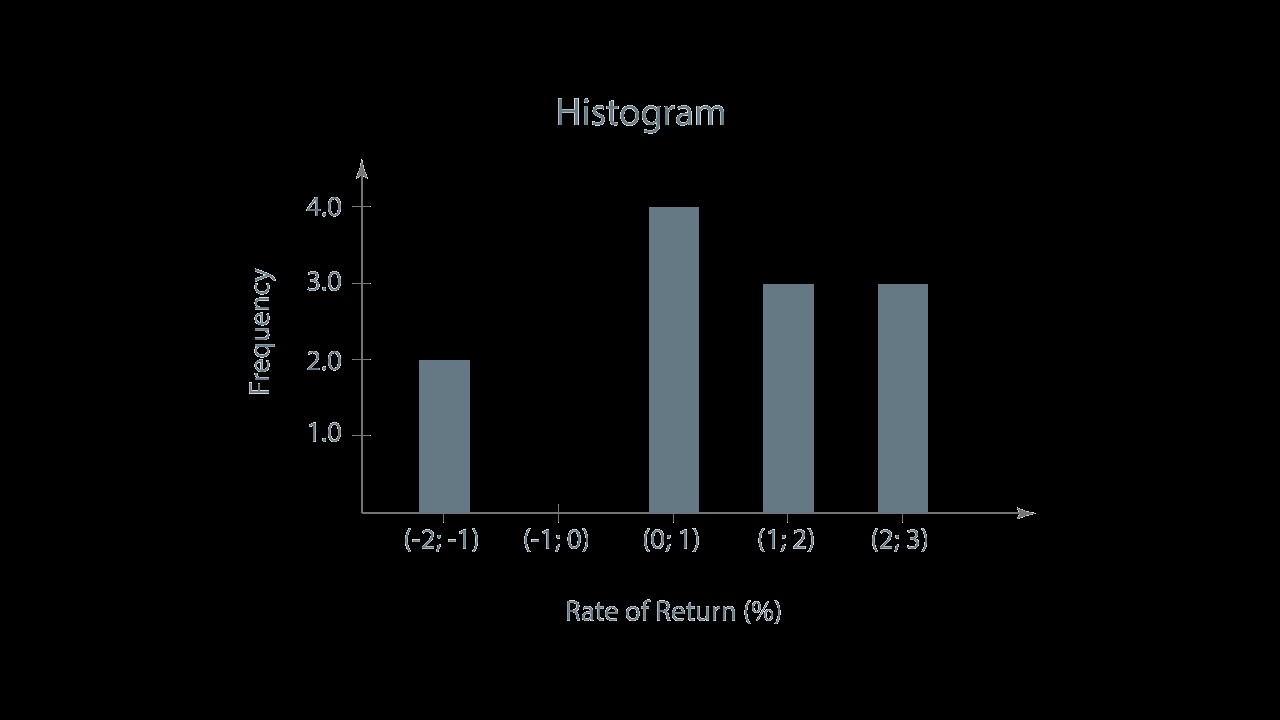
You can easily notice that the interval with the rate of return ranging from 0 to 1% has the greatest frequency. The frequency amounts to 4.
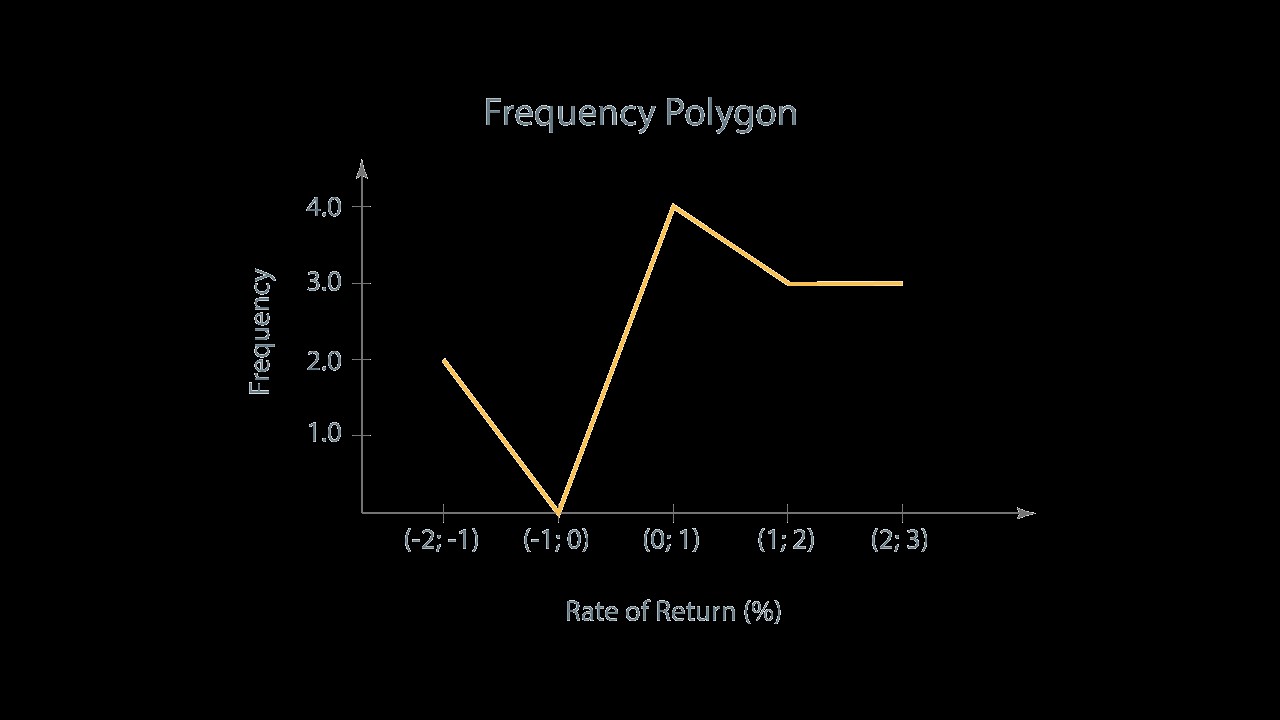
Frequency Polygon
To draw a frequency polygon, the other popular graphic tool for presenting statistical data, we need to plot the midpoints of all intervals on the x-axis and the respective absolute frequencies on the y-axis. Then we need to connect the points with a straight line. A frequency polygon provides us with similar information to that we can find in a histogram.
(...)

Level 1 CFA Exam Takeaways: Introduction to Descriptive Statistics & Data Visualization
star content check off when done- Descriptive statistics deals with the synthesis, processing, and presentation of data. Inferential statistics (statistical inference) is aimed at making generalizations concerning a population based on its sample.
- A population consists of all elements of a group.
- A sample is a subset of a population.
- We can divide data into 2 groups: numerical data (aka. quantitative data) which includes continuous data and discrete data, and categorical data (aka. qualitative data) which includes nominal data and ordinal data.
- Nominal data (unordered data) is most commonly of a qualitative rather than quantitative nature.
- Ordinal data (ordered data) can be ranked and ordered in terms of their size or significance.
- Cross-sectional data are data showing the values of properties of different things at a specific point in time.
- Time-series data is a set of observations at different times.
- Panel data describe one or more variables of multiple observational units over a period of time.
- Absolute frequency is the number of observations falling in an interval.
- Relative frequency is absolute frequency divided by the number of all observations.
- When we want to summarize multiple variables simultaneously we can use a contingency table.
- The most common tools for graphic presentation of data are: histogram, frequency polygon, cumulative frequency distribution chart, bar chart (including grouped bar chart & stacked bar chart), tree-map, word cloud (aka. tag cloud), line chart (including bubble line chart), scatter plot, and heat map.