Level 1 CFA® Exam:
Chart Patterns & Technical Indicators
First, let's discuss the most popular chart patterns, or formations, that indicate the future direction of price movement. The most important distinction is between reversal patterns, which indicate that a trend will change, and continuation patterns, indicating that it won't. Note that we only deal with a pattern if there is a trend.
Reversal Patterns
Head and shoulders
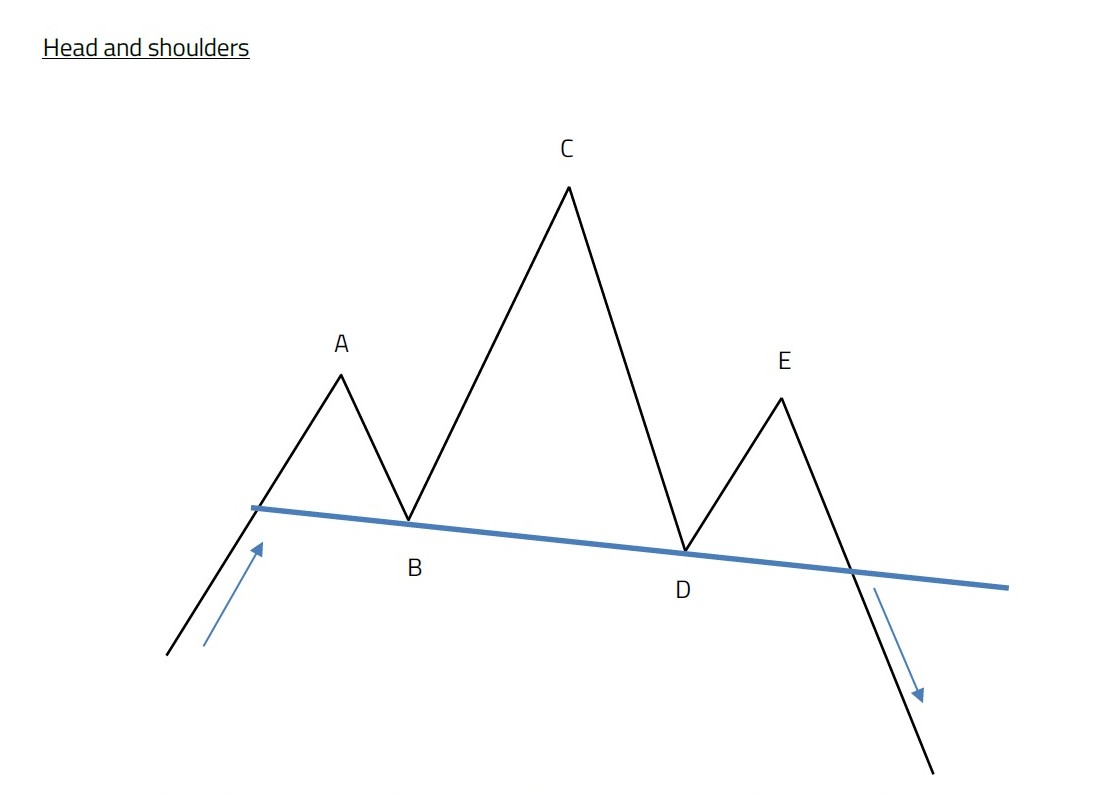
Head and shoulders is one of the most common reversal patterns. It appears when an upward trend reverses. Prices reach point A, called the left shoulder, after which they move to point B. A price moves to point A with rising volume. Then from point A on, the volume goes down. Then there is a rise moving from point B to point C (called the head), located higher than point A. This rise is often accompanied by a decrease in volume, which may be a valuable indicator of a trend reversal.
A situation when 2 characteristics (here it's price and volume) don't simultaneously confirm the existing trend is called divergence. Then, prices go down to point D, located at the level of the previous bottom (marked as point B) or slightly above it. Points B and D delineate what is referred to as the neckline. The rally beginning with point D finishes at point E (called the right shoulder), located lower than the head. The decrease starting at point E that crosses the neckline completes the head and shoulders pattern and heralds a reversal from the uptrend to a downtrend.
A breach of the neckline often involves an increase in volume. An analogical pattern in a downtrend is called an inverse head and shoulders. We often try to determine the potential range of a pattern, which in the case of a head and shoulders can be described with this formula:
price target = neckline - (head - neckline)
(...)
Triangles
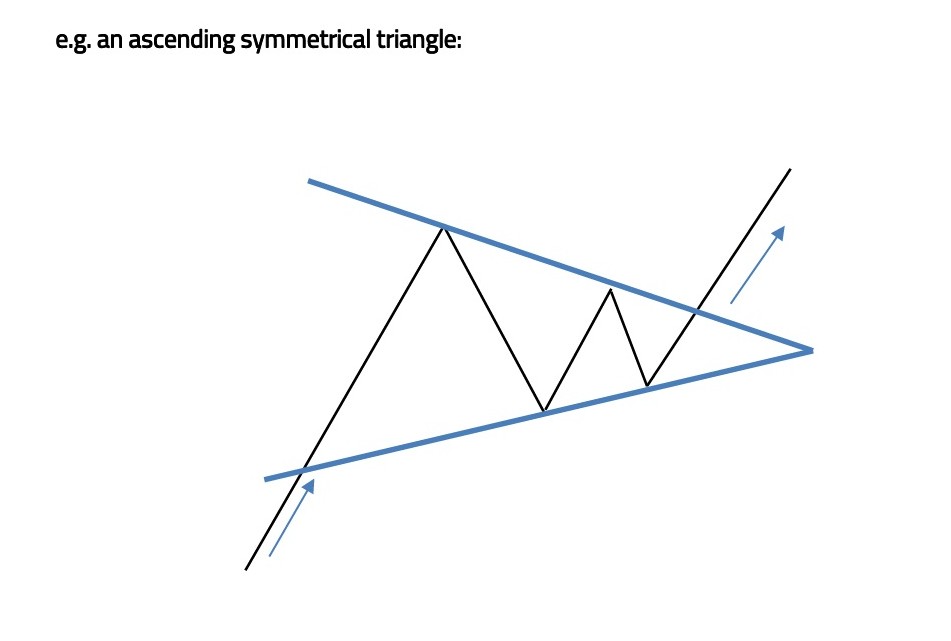
A triangle pattern is made up of a sequence of tops and bottoms with the trendlines narrowing, which reflects a narrowing range of price volatility. One characteristic feature of this pattern is that during the formation of a triangle volume is decreasing and rebounds once a breakout occurs. As the name of the pattern suggests, when we draw trendlines connecting the tops and the bottoms, we get a figure similar to a triangle. A breakout of a triangle occurs when its trendlines are crossed, usually somewhere between half and three-quarters of the length of the pattern. We distinguish among ascending triangles, descending triangles, and symmetrical triangles.
(...)
Flags and pennants
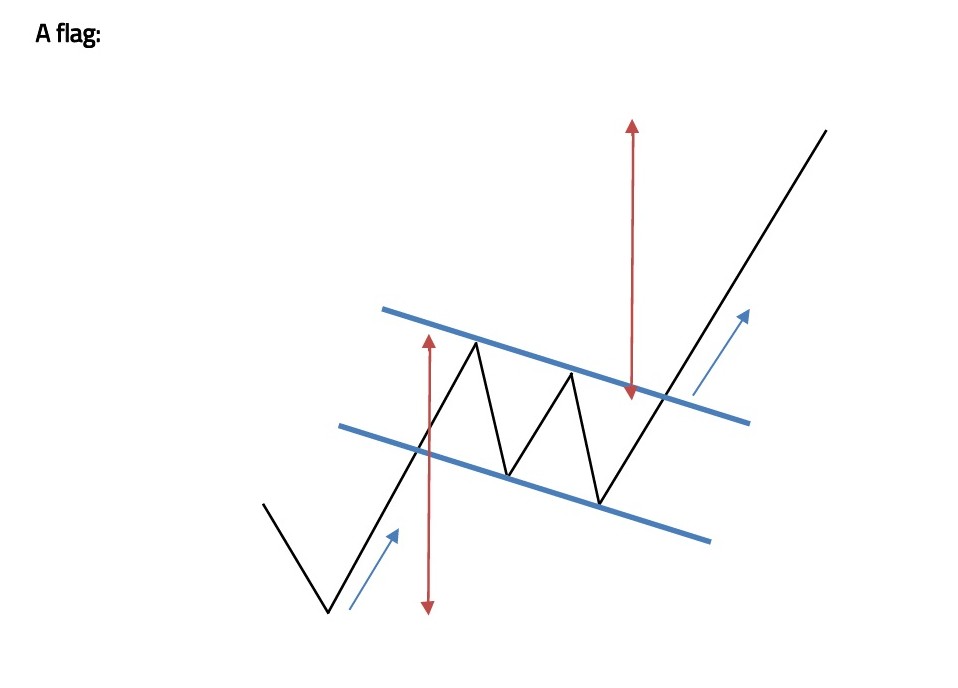
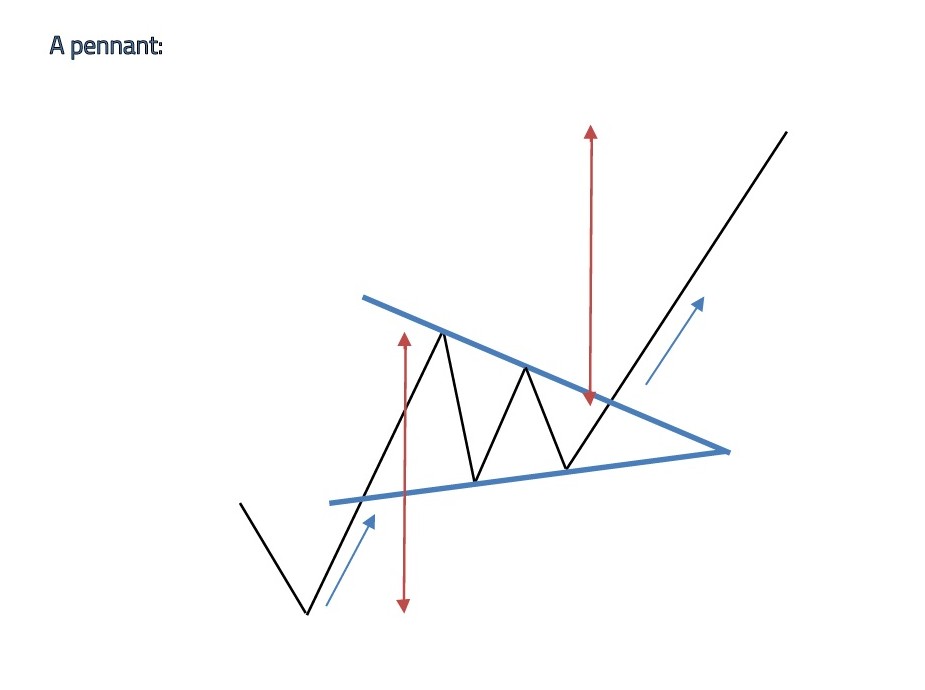
Flags and pennants have quite substantial predictive validity, but they are a rare pattern that forms during rapid price movements. They usually last for a short time, usually over one week. A flag is shaped like a parallelogram, with the trendlines usually sloping against the main trend. Pennants resemble small symmetrical triangles.
Bear in mind that the patterns we have discussed may be analyzed in different time intervals and their identification is to a large extent subjective.

Let's now move on to another group of tools in a technician's toolkit, i.e. technical indicators. Technical indicators supplement the information that technical analysts infer from price charts. They can help us understand the situation in the market and take the right decision. We're going to briefly characterize 3 groups of indicators, namely:
- price-based indicators,
- momentum oscillators, and
- sentiment indicators.
Price-based indicators include present and historical data on the prices of the analyzed asset.
One such indicator technicians often use is the moving average. A moving average is the average price of an analyzed instrument in a selected time frame. It is based on closing prices, but we can also use average prices from an interval or opening prices, etc. The most frequent moving averages include 5, 9, 10, 18, 20, 40, 50, 60, and 200-day moving averages.
When a strategy combining two moving averages, e.g. a 9-day and an 18-day, is used, a buy signal appears when the short-term average crosses the longer one from underneath. This movement is called a golden cross. Analogically, when a 9-day average crosses an 18-day average from the top (which we call a dead cross), a bearish market is heralded.
Bollinger bands are based on the concept of the moving average. A moving average line is accompanied by two other lines: one above and the other one below the moving average. The two additional lines run at a distance from the moving average set as a certain number of standard deviations from a pre-defined period. The two lines delimit a price channel measured with volatility. In other words, the increasing volatility of an instrument translates into a greater distance between the two lines.
Another group of indicators is momentum oscillators, which can help us establish if a trend is getting stronger or weaker.
(...)
The third group of technical indicators is sentiment indicators. They are used to measure investors’ sentiments or moods. Their task is to help predict an upcoming bull or bear market.
Market participant sentiment is gauged using opinion polls or market data, based on which different sentiment indicators are constructed. Let's briefly discuss 3 of them:
- the put/call ratio,
- the CBOE Volatility index (aka. VIX), and
- the margin debt.
So, one type of sentiment indicator is the put/call ratio. Prices of call options go up when an increase in the value of their underlying asset is anticipated. Prices of put options go up when we expect a drop in the value of the underlying assets. A high or growing put/call ratio indicates that investors are not optimistic about the market's prospects. A low or falling put/call ratio reflects investors' optimism.
The CBOE Volatility index (VIX), sometimes called the fear index, shows expectations about volatility in the spot market. VIX measures volatility calculated from selected call and put options on the Chicago Board Options Exchange. The greater the value of the VIX, the greater the volatility and investors' fear of falling prices.
A useful tool for sentiment analysis can be margin debt. Growing margin debt often occurs in a bullish market. Many new investors encouraged by a market rally start to borrow more and more aggressively when buying assets. At the same time, high margin debt may hint the end of an increased buying period and herald a correction.
- Reversal patterns indicate that a trend will change, on the other hand, continuation patterns indicate that they won't.
- Reversal patterns include: head and shoulders, double tops, double bottoms, triple tops, and triple bottoms.
- Continuation patterns include triangles, rectangles, flags, and pennants.
- There are 3 main groups of technical indicators: price-based indicators, momentum oscillators, and sentiment indicators.
- Price-based indicators include present and historical data on the prices of the analyzed asset.
- Momentum oscillators help us establish if a trend is getting stronger or weaker.
- Opposite to divergence, convergence confirms the current trend.
- The most popular momentum oscillators include: the rate of change oscillator, the relative strength index, the stochastic oscillator, and the moving-average convergence/divergence oscillator.
- Sentiment indicators are used to measure investors’ sentiments or moods.