Level 1 CFA® Exam:
Estimation – Introduction
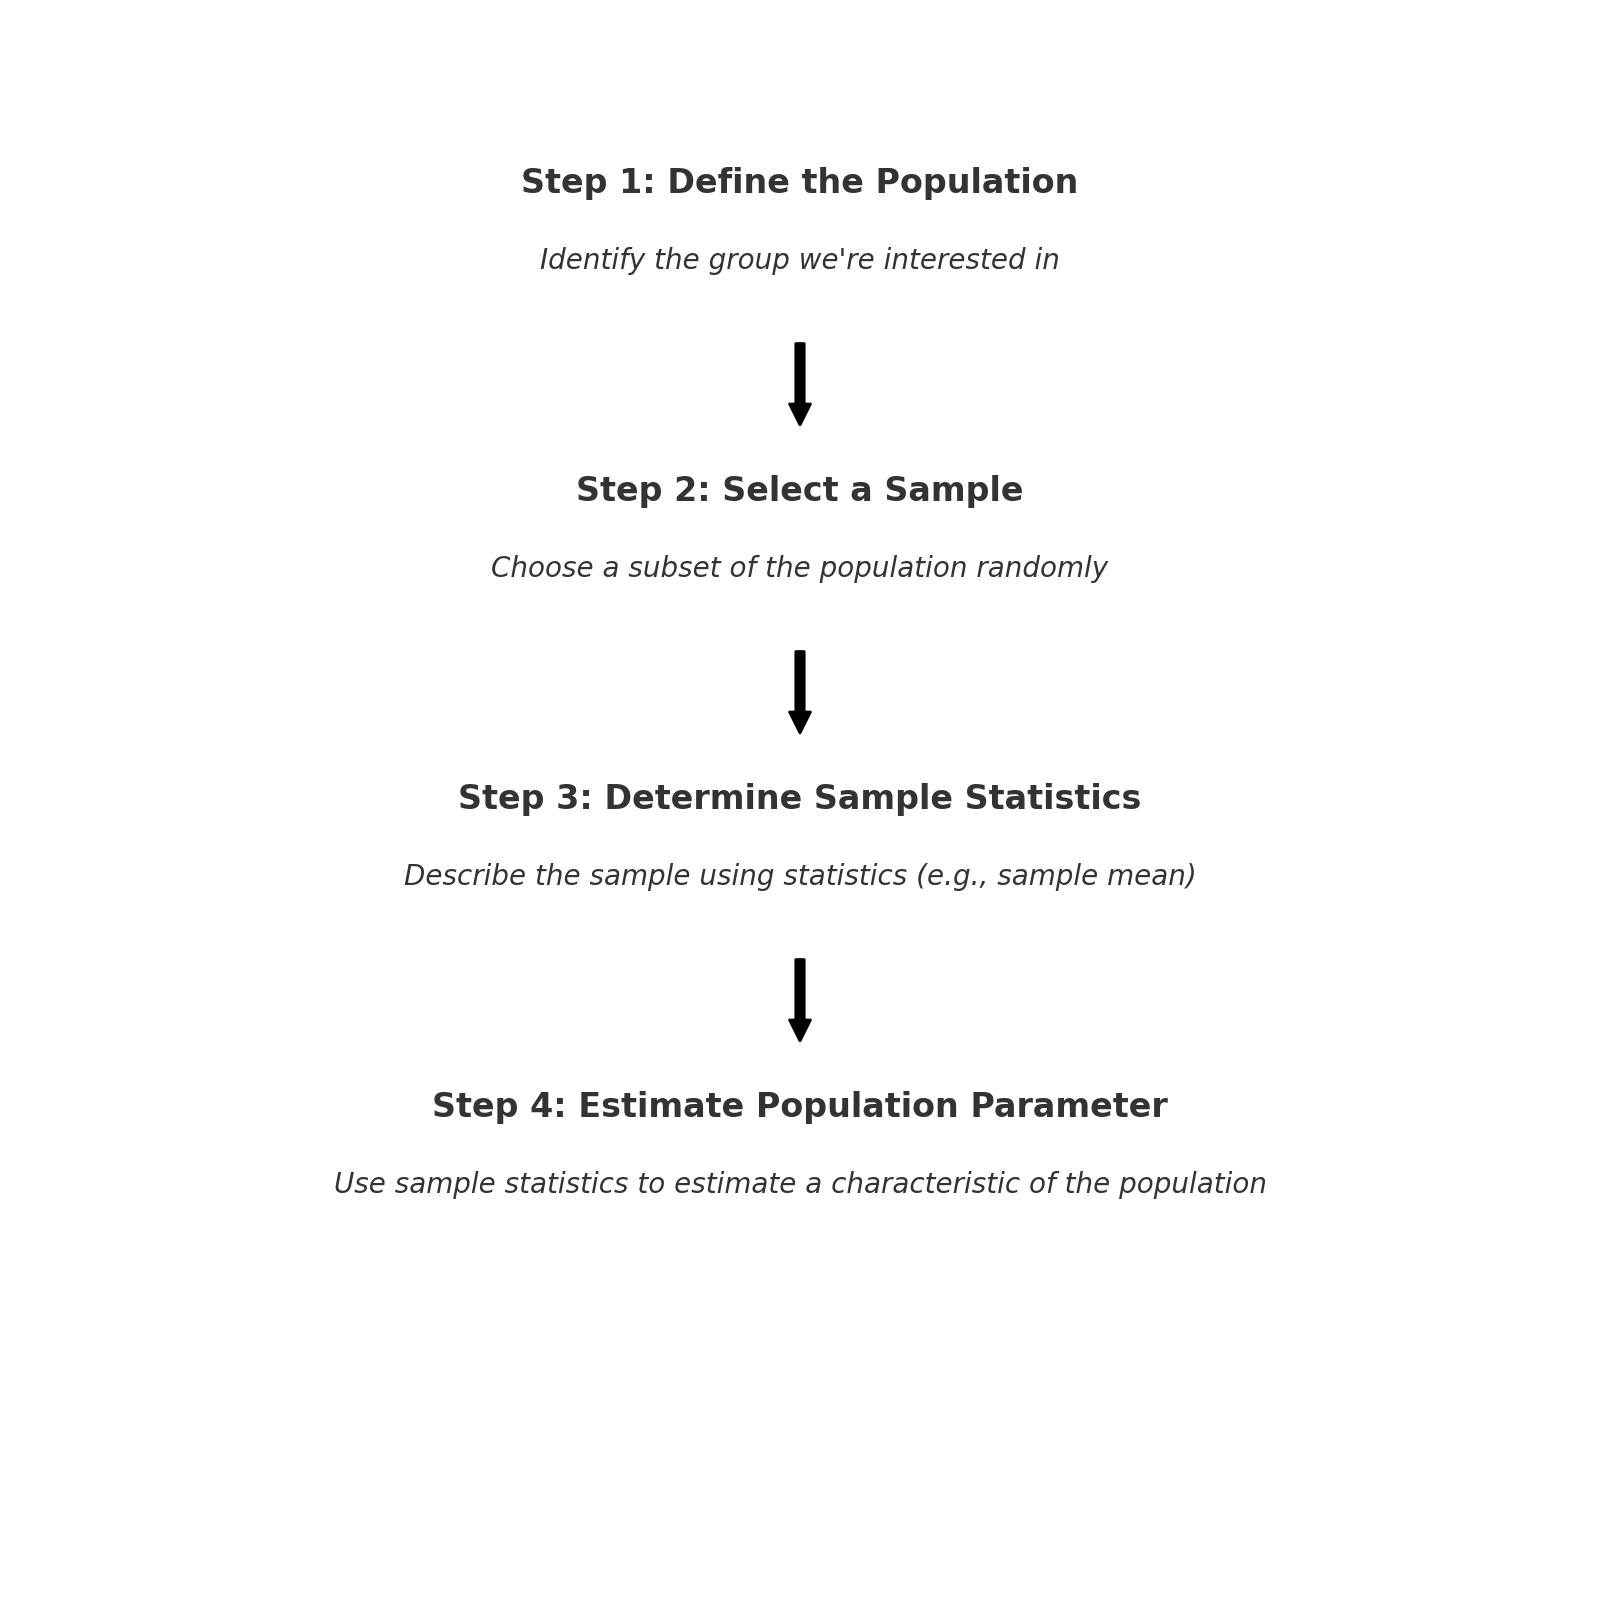
We start this level 1 CFA exam lesson by defining population, sample, and parameter.
A population consists of all elements of a group. It can be perceived as a set of all the members of the group we're interested in.
A sample is a subset of a population. A sample is usually selected randomly. A sample is described by the so-called sample statistics, for example, a sample mean.
A parameter is a descriptive characteristic of a population.
When do we use samples and sampling in real life?
We make generalizations concerning a population based on its sample. In other words, on the basis of a sample, we try to draw conclusions about the entire population employing methods based on the probability theory.
In other words, we use samples every time we want to make a statement about a population based on a sample. For example, if we want to find out the chances of election of a presidential candidate, or when we want to describe the stock market based on a representative index, and so on.
A simple random sample, or a random sample for short, is a subset of elements selected randomly from a population in such a way that each element of the population has an equal chance of being included in the sample. If our sampling plan, that is the rules that we establish for the sampling process, is accurate, the sample will represent the population well.
Simple random sampling is the process of drawing a simple random sample from a population.
You should be aware that sometimes we aren’t able to identify all the elements of a population. In such a case, we can use systematic sampling and then the sample obtained in the procedure is called a systematic random sample. Systematic random sampling is when sampling takes place in any systematic way. One example would be choosing every tenth number from a phone book. A systematic random sample usually represents the whole population well.
It may happen that simple random sampling won’t cover events that are of interest to us. To ensure the existence of certain groups in the sample, stratified random sampling is used.
In stratified random sampling, the population is divided into subpopulations (also called strata) based on one or more criteria. Then, from each stratum, with the aid of simple random sampling, we select a number of elements proportional to the relative size of each stratum in the population and get them together.
If we have a sample, we can determine the values of the statistics that describe it. Statistics are numerical characteristics of a sample and are used to estimate population parameters. A parameter is a real value that describes the selected characteristic of an entire population. The examples of sample statistics are sample mean or sample standard deviation.
The observed sample statistic usually differs from the actual value of a parameter. To measure the difference, we use sampling error. Sampling error is the difference between the observed value of the sample statistic and the population parameter which is estimated using this sample statistic.
Often we are interested in sampling error in the context of means.
We know that the population mean equals 4. We draw a sample from this population and calculate the mean of the observations included in the sample. This mean value is our sample statistic, which in this particular case may be also called the sample mean. If the sample mean equals 4.2, then the sampling error equals:
\(\text{sampling error}=4.2-4=0.2\)
But let’s imagine that we draw another sample from the population. Would the sample mean and the sampling error be the same as in the previous sampling? Probably not. If for example the sample mean equaled 4.1, then the sampling error would equal to:
\(\text{sampling error}=4.1-4=0.1\)
(...)

While doing sampling, a very common question is: how big a sample should be? Of course, it would be best if it was the biggest possible sample because the bigger the size, the fewer standard errors. And the fewer standard errors, the less uncertainty about the estimates. The ideal situation would be to know the entire population as we would know the exact values of the parameters that are of interest to us. Unfortunately, in most cases, this isn’t the case. We must remember that the more sure we want to be about our estimates, the bigger sample we need.
Having said that, let’s move to the types of biases.
The four types of biases that you should be familiar with on your exam are:
- data-mining bias (aka. data snooping bias),
- sample selection bias,
- look-ahead bias, and
- time-period bias.
(...)
- A simple random sample (random sample) is a subset of elements selected randomly from a population in such a way that each element of the population has an equal chance of being included in the sample.
- Simple random sampling is the process of drawing a simple random sample from a population.
- Systematic random sampling is when sampling takes place in any systematic way.
- In stratified random sampling, the population is divided into subpopulations (strata) based on one or more criteria.
- Statistics are numerical characteristics of a sample and are used to estimate population parameters.
- Sampling error is the difference between the observed value of the sample statistic and the population parameter which is estimated using this sample statistic.
- Cross-sectional data are data showing the values of properties at a specific point in time.
- Time-series data is a set of observations at different times.
- Data mining is a method of extensive searching through a dataset for statistically significant patterns in the gathered collections of information.
- Sample selection bias occurs when we systematically exclude from the data set some information that is relevant to the whole sample.
- Survivorship bias occurs when we analyze only the current, most up-to-date data.
- Look-ahead bias is when we process data that aren't available on the simulation date.
- Time-period bias usually occurs when we use a short time series of data and the results may not be significant in a longer period.