Level 1 CFA® Exam:
Utility Theory
As a rule, the measures of risk don't take into consideration the subjective experience of risk. Risk is considered from a subjective perspective because of the psychology of each entity investing in any financial instrument.
One theory that takes into consideration the subjective perception of risk by an investor is the utility theory. Despite criticism, it has been one of the most popular theories considering the individual psychological characteristics of an investor.
The utility theory is based on the utility function. The function differs from person to person and can change over time (for example as the investor is growing more experienced).
The utility function assigns a particular utility value – that can be understood as the level of a person's satisfaction – to a given monetary value. According to the utility theory, every person should seek to maximize his or her utility. From the point of view of an investor, the utility function can be perceived in terms of risk and return. An investor's utility function for a particular investment can be described this way:
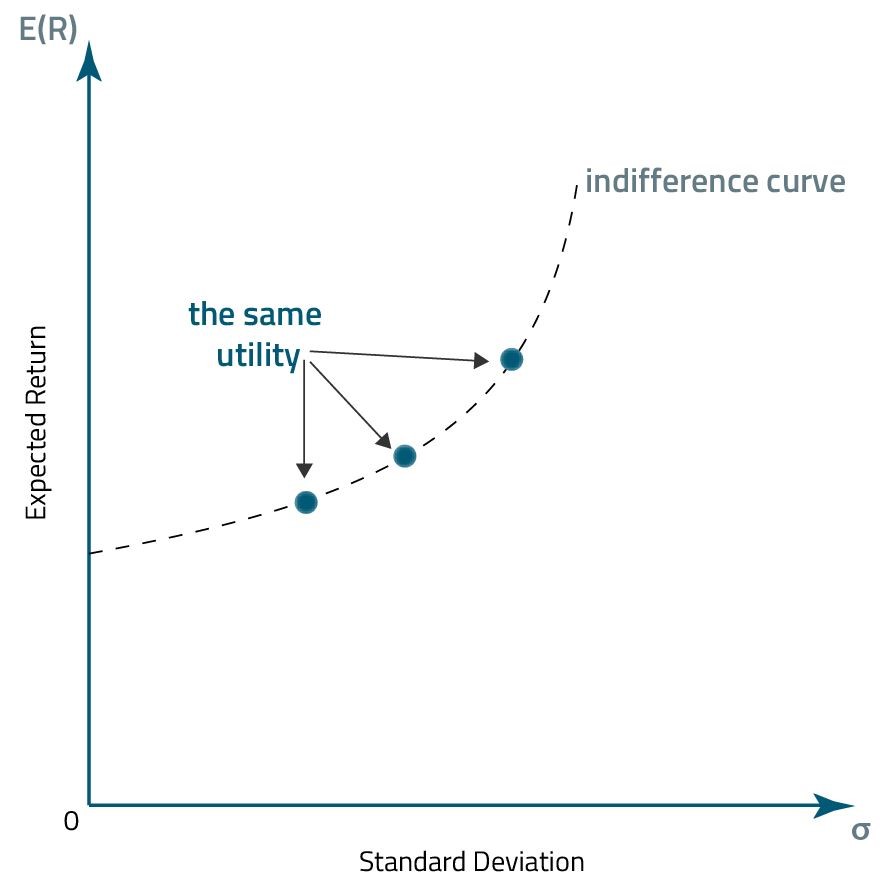
A graph representing the utility function is called an indifference curve. At each point of the indifference curve, an investor's utility is the same.

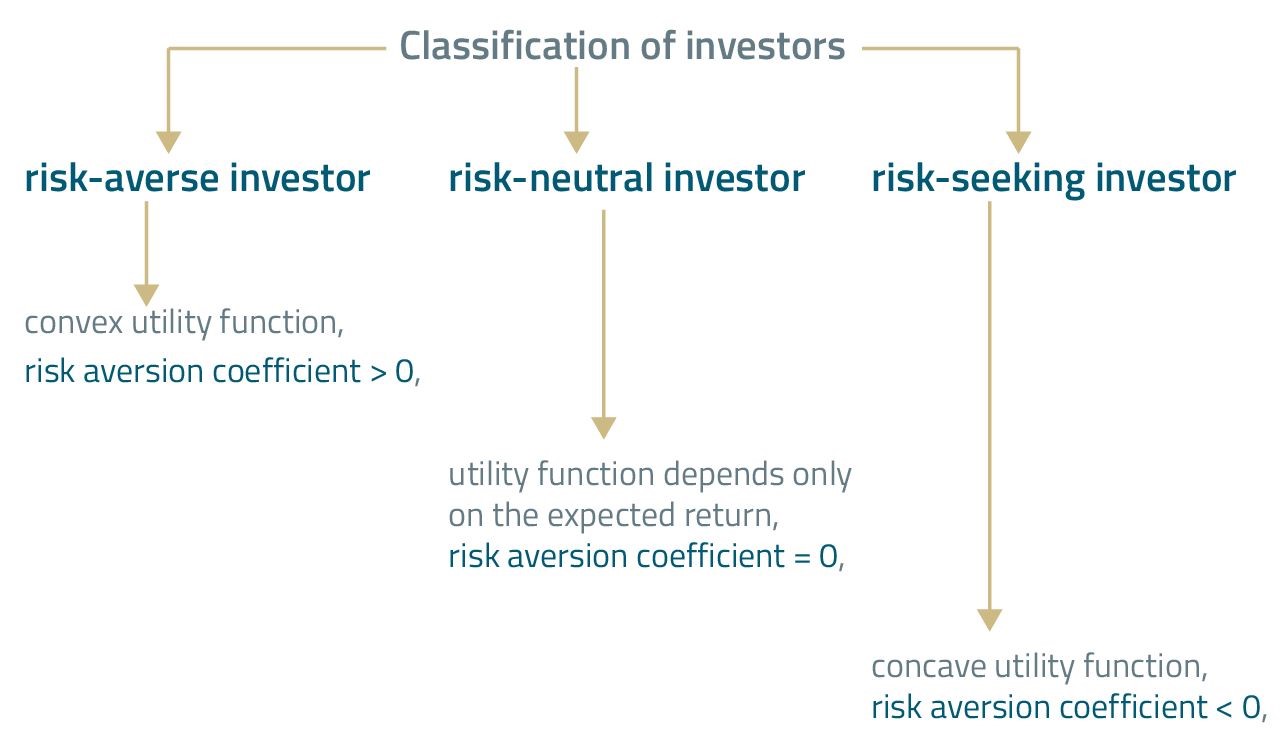
Based on an investor's attitude to risk, we can distinguish among 3 types of investors.

(...)
Let's determine the utility of an investment with an expected return of 20% and a standard deviation of 30%. Additionally, we assume that the investor's risk aversion coefficient is 4.
(...)
Let's try and determine the utility of an investment with the same expected return of 20% and the same standard deviation of 30%. This time, however, we assume that the investor's risk aversion is 2.
(...)
Note: When an investor is characterized by lower risk aversion, he achieves greater utility for a given expected return and standard deviation. Also, what follows from the utility function is that all else equal the higher the expected return, the higher the utility for all 3 types of investors.
A risk-neutral investor is not sensitive to risk. The higher the risk, the higher the utility of risk-seeking investor, and the lower the utility of risk-averse investor.
Utility alone does not tell us much. What can we tell about an investor if we know that his utility of investment is 0.02 or 0.11? The number alone does not tell us much, but utility allows us to rank investments from the most to the least beneficial for the investor.
Note: The lower the risk aversion, the higher the risk tolerance. And conversely, the higher the risk aversion, the lower the risk tolerance.
A properly defined utility function can help us select the right portfolio for an investor. The most popular way to present an investment is in risk-return pairs. An optimal investor portfolio is located at the tangent of the function describing an investment, called the capital allocation line (CAL) and the indifference curve.
The capital allocation line is a line connecting a risk-free asset with the portfolio of risky assets. It reflects the return of an investor's portfolio depending on risk measured with standard deviation. It can be expressed with this formula to be used in your level 1 CFA exam:
Which can be rewritten in the following way:
(...)
- The utility theory is based on the utility function.
- The utility function assigns a particular utility value – that can be understood as the level of a person's satisfaction – to a given monetary value.
- According to the utility theory, every person should seek to maximize his or her utility.
- At each point of the indifference curve, an investor's utility is the same.
- An investor with a convex utility function is characterized by risk aversion and is therefore called a risk-averse investor.
- A risk-neutral investor is not sensitive to risk.
- A concave utility function characterizes a risk-seeking investor.
- The lower the risk aversion, the higher the risk tolerance.
- An optimal investor portfolio is located at the tangent of the capital allocation line (CAL) and the indifference curve.


