CFA® Exam: Standard Deviation (Use DATA & STAT Worksheets!)
This blog post was created as a part of the CFA exam review series to help you in your level 1 exam revision, whether done regularly or shortly before your CFA exam.
In your exam, always use the STAT and DATA worksheets in your calculator to compute the standard deviation. Have a look at the following example.
How to Calculate Standard Deviation Using TIBA II Plus
Example
You are given the following data:
Assuming that the data given in the table above covers the whole population of rates of return for a given stock, compute the standard deviation of the population.
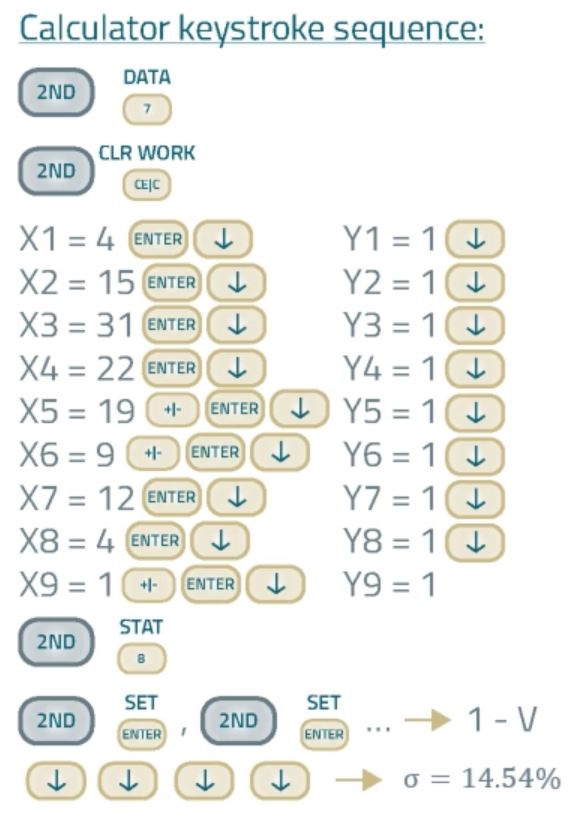
We won’t be applying any formulas here. Instead, we will use the DATA and STAT worksheets in the TIBA II Plus Professional calculator. Have a look at the calculator keystroke sequence:
Application of DATA & STAT Worksheets
The first step is to enter the rates of return into your financial calculator using the statistical DATA worksheet. Then, you'll need to switch to the STAT worksheet and read the relevant measures.
So, begin by pressing [2nd] [DATA] to access the data worksheet. In the DATA worksheet, enter rates of return for Xs, namely X1 equals 4, X2 equals 15, and so on. Note that there's no point in entering percent, so instead of 0.04 enter 4, instead of 0.15 enter 15, and so on. All Ys are equal to 1 because there is only one variable, namely the rate of return. After you enter all returns, press [2nd] [STAT] and set the calculator in one variable mode. There are 5 available modes. We will choose one variable statistics (1-V). Sometimes – on your level 1 exam – when data for two variables is given, you will choose Linear mode (LIN), but other modes are not used on the level 1 exam.
We press the arrow down until we find the population standard deviation noted as sigma '\(\sigma\)'. As you can see, the calculator computes also the number of observations, the arithmetic mean, the sample standard deviation noted as 's', the sum of Xs, and the sum of Xs squared. If you set the STAT worksheet in two variable mode – for example Linear mode – you will get these data for both variables, the independent and dependent ones. You will also obtain the correlation coefficient and beta.
Struggling with Your Calculator?
Check out our e-book with TIBA II PLUS tips
Check out our
e-book with TIBA II PLUS tips
(including Professional)